SUICIDE PREDICTION: A Socioeconomic Analysis
data exploration
Data Collection
This project uses data from multiple sources, including:
- GDP: Economic data of various countries.
- Weather: Climate data such as temperature and weather conditions.
- Happiness Index: Global happiness scores.
- Suicide Rates: Historical data on suicide rates.
- Population: Population statistics for each country.
Data Preparation
-
Data was collected using web scraping and APIs to ensure authenticity and reliability.
-
The collected data was cleaned by:
-
Handling Missing Values: Imputed or removed missing data points as appropriate.
-
Removing Outliers: Identified and removed anomalies to ensure data integrity.
-
Ensuring Consistency: Standardized formats across different datasets.
-
-
Multiple CSV files were merged to create a comprehensive dataset for analysis.
Data Visualizations
-
Various data visualizations, including bar charts, scatter plots, line graphs, and heatmap, are used to represent relationships between factors and suicide rates.
-
Each visualization provides insights into trends and correlations that influence suicide rates, helping to visualize complex data in an understandable manner.
Insights from visualizations
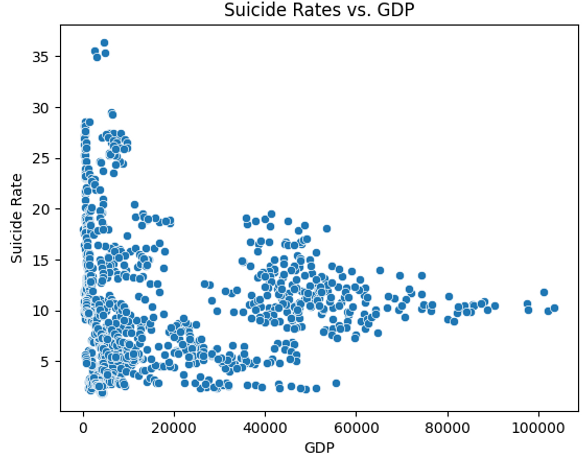
1. Scatter Plot of Suicide Rates vs. GDP
The scatter plot shows an inverse relationship between GDP and suicide rates, with higher GDP countries generally experiencing lower suicide rates. Countries with low GDPs tend to have a broader range of higher suicide rates, likely due to economic stress and limited mental health resources. In the middle GDP range, there is more variability in suicide rates, reflecting diverse socio-economic conditions. High GDP countries, typically above $60,000, exhibit consistently lower suicide rates. This trend suggests that economic stability and access to resources in wealthier countries may contribute to lower suicide rates.

2. Bar Plot of Suicide Rates by Country
This bar chart lists the top 10 countries with the highest average suicide rates, led by Guyana, Central African Republic, and Suriname. Guyana has the highest rate, significantly above the others, followed by the Central African Republic and Suriname with similar rates. The list includes countries across Africa, South America, and Asia, suggesting that high suicide rates are not confined to one continent but may relate to socio-economic or healthcare challenges shared by these nations. Each of these countries has an average suicide rate of around 15 or higher, indicating persistent mental health challenges.

3. Boxplot of Suicide Rates by Happiness Level
The box plot shows that suicide rates generally decrease as happiness levels increase. "Low" and "Medium" happiness levels have higher and more variable suicide rates, while "High" and "Very High" levels show lower rates with less variation. The median suicide rate is lowest in "High" happiness countries. "Very High" happiness countries have slightly higher median rates than "High," but still lower than "Low" and "Medium." Overall, higher happiness levels seem linked to lower suicide rates.

4. Histogram of Suicide Rates Distribution:
This histogram shows the distribution of suicide rates, with most rates clustered around the 2.0 to 2.5 range. The data has a roughly bell-shaped pattern, indicating a peak frequency around 2.5, where the majority of observations lie. Suicide rates lower than 1.5 and higher than 3.0 are less common. The distribution is moderately symmetrical, but there is a slight skew towards higher rates. Overall, suicide rates tend to center around the average, with fewer instances at the extremes.

5. Bubble Plot of Suicide Rates vs. Population
This plot shows that suicide rates don’t have a clear correlation with population size. Lower happiness index scores (blue) generally align with higher suicide rates, suggesting a possible link between happiness and suicide. Suicide rates mostly range between 2.0 and 2.5, regardless of population size. Both high and low rates appear across diverse populations, indicating other influencing factors. The log scale aids in displaying the spread of data across small and large populations.
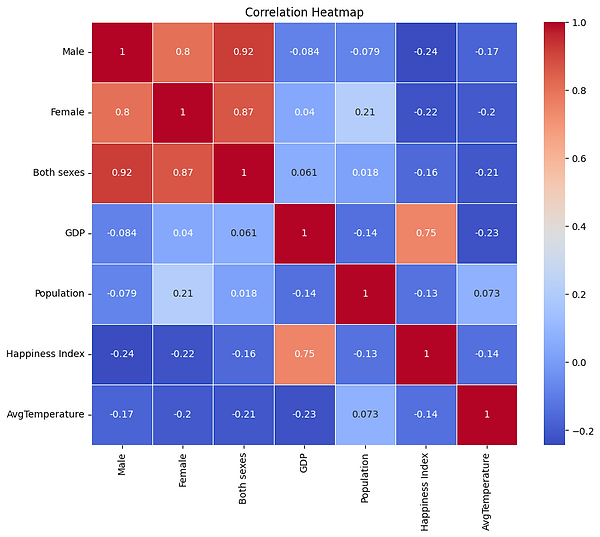
6. Heatmap by all correlations
This show the correlation about these factors (male_suicide_rate, female_suicide_rate, both_suicide_rate, GDP, Population, Happiness Index, Temperature) Although we are looking for the suicide rate with other factors, this picture shows happiness index is proportional to GDP. This means the happiness index getting higher, and GDP would be greater.
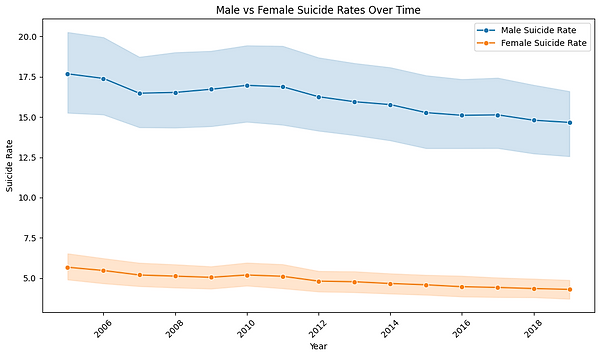
7. Line plot by Suicide rates over time for both males and females
This graph highlights the disparity in suicide rates between males and females from 2006 to 2018 with males consistently showing higher rates. The male suicide rate fluctuates between 15 and 20 per 100,000, while the female rate remains around 5 per 100,000. Both rates exhibit a gradual downward trend, indicating a general improvement over time. The shaded areas suggest variability, with male rates displaying more fluctuation than female rates. Despite the overall decline, a persistent gender gap in suicide rates remains evident.

8. Scatter plot by suicide rate and temperature
This scatter plot suggests that temperature could be an important factor influencing suicide rates, as there is a noticeable concentration of higher suicide rates in regions with moderate to warm temperatures, particularly between 50-80 degrees. This clustering pattern indicates that suicide rates tend to increase in warmer climates, implying a potential association between warmer temperatures and mental health stressors.

9. Pie chart by suicide rate of male and female
This pie chart reveals a significant gender disparity in suicide rates, with males accounting for 76.7% of cases compared to 23.3% for females. This contrast underscores the higher vulnerability of males to suicide, suggesting gender-specific factors may play a role in mental health risks.

10. World map with suicide rate of both sexes
This global map visualizes the suicide rate for both sexes from 2000 to 2019. It shows significant regional variation, with higher rates in parts of Africa, Eastern Europe, and some areas in South America, as indicated by darker shades. In contrast, lower rates are observed in regions like the Middle East, Southeast Asia, and Central America, depicted in lighter shades.